
Congratulations, You’re in 10,000 Stores. Unfortunately, They’re the Wrong 10,000.
Why numerical distribution can make an FMCG sales team feel successful while weighted distribution, velocity, and productive doors tell a very different commercial story.
Congratulations, You’re in 10,000 Stores. Unfortunately, They’re the Wrong 10,000.
Why Numerical Distribution Can Make an FMCG Sales Team Feel Successful While Weighted Distribution Tells a Very Different Story
There are few numbers in FMCG that create more immediate satisfaction than outlet count. “We are now in 10,000 stores” sounds impressive, looks impressive on a slide and tends to be accompanied by a green arrow pointing confidently upwards. If the company was in 6,500 stores three months earlier, somebody may even call the quarter transformational. The difficulty is that 10,000 stores can mean almost anything. They may be high-volume outlets where the category turns quickly and shoppers are actively buying products like yours, or they may be small, low-rotation locations where the product sits quietly on a shelf and the owner cannot quite remember when it arrived. Numerical distribution counts both as one, which is both its great strength and its obvious weakness.
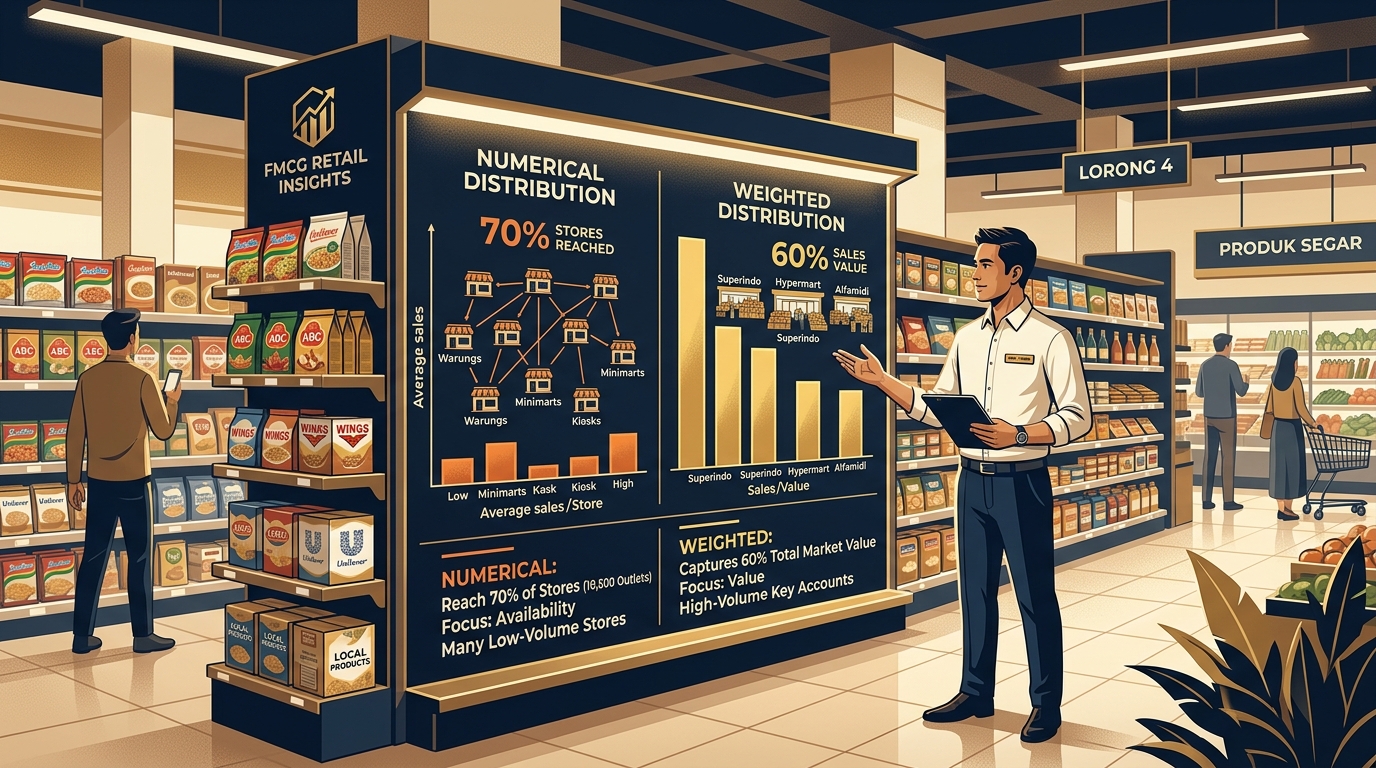
At its simplest, numerical distribution tells you how widely your product is available. If your relevant universe is 20,000 outlets and your brand is listed in 10,000 of them, your numerical distribution is 50%. That is useful information. What it does not tell you is whether those 10,000 outlets matter very much to the category. This is where weighted distribution becomes far more interesting, because weighted distribution asks not merely how many doors you have opened but how important those doors are in terms of category sales. In other words, numerical distribution tells you where you are present; weighted distribution tells you how much of the category opportunity sits behind those doors.
Imagine an Indonesian beverage company launching a new isotonic drink. After three months, the sales team proudly reports that the product is present in 10,000 of the 20,000 relevant outlets. The numerical distribution is therefore 50%, and at first glance that feels like a respectable launch. The team has opened half the market, or at least half the physical universe, and there is every chance the chart in the monthly sales presentation will be coloured green. Then someone asks what proportion of total category sales is generated by those 10,000 outlets. It turns out the brand is disproportionately present in smaller stores, secondary locations and lower-volume independents. Together, those outlets account for only 25% of total isotonic-drink sales. The brand therefore has 50% numerical distribution but only 25% weighted distribution.
That changes the conversation rather quickly.
The sales team has not done anything wrong. The product really is in half the outlets. The problem is that only one quarter of the category value is being generated in those outlets. The company is distributed widely, but not particularly well. If the same market contains a premium competitor present in only 4,000 outlets, the comparison can become even more uncomfortable. Four thousand outlets represent only 20% numerical distribution, which looks weak beside your 50%. But if those outlets include the highest-volume supermarkets, the strongest minimarket locations, key urban stores and major online accounts, they might represent 60% of total category value. The competitor then has only 20% numerical distribution but 60% weighted distribution. It is in far fewer places, yet it is standing exactly where far more of the money is being spent.
This is why outlet count can be dangerously comforting. A door is a door in a CRM system, but commercially doors are not equal. A high-throughput supermarket in Jakarta is not the same economic object as a quiet independent store in a small provincial town. A minimarket beside a commuter hub may sell several times the category volume of an otherwise identical store in a low-traffic location. A major marketplace seller can generate the equivalent of hundreds of physical outlets, even though numerically it may still count as one account. Weighted distribution corrects for this by asking how important each location is to the category rather than treating every listing as equal.
This distinction matters particularly in Indonesia because the route to market is so fragmented. Modern trade, minimarkets, wholesalers, traditional trade, specialty stores and e-commerce all coexist, and each channel can contain enormous differences in productivity. A company can add thousands of outlets and still make only modest progress if those new listings sit in low-value parts of the market. Conversely, a smaller brand may appear to have limited physical reach while already accessing a disproportionately large share of category turnover because it has secured the right customers first.
That is why numerical distribution is not a bad metric. It is simply incomplete when used on its own.
For many categories, physical reach matters enormously. Snacks, affordable beverages, confectionery, sachets, personal care and other impulse or convenience-led products depend heavily on being easy to find. A consumer cannot buy what is not there, and weighted distribution offers little comfort if your product is missing from the places where consumers actually shop. The danger appears when the company starts treating “more outlets” as synonymous with “better distribution.” Sales organisations are very good at delivering the metric attached to the incentive. If the target says add 5,000 outlets, there is every chance the field team and distributor will add 5,000 outlets. Whether they are the best 5,000 is another question entirely.
This is one of the reasons numerical-distribution targets can accidentally encourage poor behaviour. The metric is simple, visible and easy to reward, so it becomes the objective rather than one part of a broader distribution strategy. A regional manager reports 1,200 new outlets, the distributor reports strong activation and head office adds another green arrow. The less glamorous question is whether those stores actually sell enough of the category to matter. It is not difficult to build distribution in outlets that are easy to open. The skill lies in building distribution in outlets where the category is relevant, the product can rotate and the economics justify the effort.
Weighted distribution becomes especially useful here because it turns outlet expansion into a resource-allocation question. Suppose a smaller Indonesian packaged-coffee brand has limited sales capacity and can pursue one of two opportunities next quarter. The first is 2,000 small outlets spread across several regions. They are relatively easy to open, and the numerical-distribution number would jump nicely. The second is just 300 difficult, high-volume stores and specialist accounts concentrated in major urban areas. The first option looks better on an outlet-count slide, but if those 2,000 stores represent only 1.5% of total category value while the 300 stronger stores represent another 8%, the commercial logic changes considerably. Fifty excellent outlets can genuinely be worth more than 500 weak ones, especially when the business is still small and every sales call, trade-spend decision and case of working capital matters.
This is also why weighted distribution should not be confused with brand sales in the outlets where you are present. The weighting is normally based on the category importance of those outlets, not on your own current performance within them. If one supermarket sells Rp1 billion of packaged coffee per year and your brand sells only Rp10 million there, that store is still strategically important because a large amount of category money is being spent in a place where your product is available. Weighted distribution is measuring access to opportunity, not how successfully you are converting that opportunity.
That distinction is extremely useful because it separates a distribution problem from a demand problem. If your weighted distribution is low, you may genuinely need to open more of the right outlets. If your weighted distribution is already high but your market share remains weak, the problem is probably elsewhere. Maybe the price is wrong, the pack architecture is weak, the shelf position is poor, the product is frequently out of stock or consumers simply prefer a competitor. High weighted distribution can therefore be useful precisely because it removes the easy excuse. If you already have 90% weighted distribution, another few thousand low-value stores are unlikely to transform the business. The brand is already available where most of the category money is being spent. At that point, you have to confront the more difficult possibility that people can buy the product perfectly well and simply are not buying enough of it.
This is where velocity belongs in the same conversation.
Distribution tells you where you can sell. Velocity tells you how well you are selling once you are there. The two measures become much more powerful when read together because they help explain what is actually happening in the business rather than merely what has been listed. A brand can improve weighted distribution and still disappoint if the new outlets generate weak rate of sale. Another brand can maintain the same distribution and grow strongly because rotation improves inside the existing customer base. One company may need more doors; another may need more demand behind the doors it already has.
Consider two brands in the same category. Brand A has 80% weighted distribution and 20% market share. Brand B has only 40% weighted distribution but already holds 15% market share. Brand A is clearly bigger, but Brand B may be commercially more interesting because it is achieving almost the same share with access to only half as much category-weighted distribution. That suggests the brand is performing exceptionally well in the outlets where it is present. The question for Brand B is not whether consumers like the product; the evidence suggests they do. The question is whether the company can expand distribution without diluting the velocity that made the original base so productive.
Brand A has the opposite problem. If it is already widely available and share remains modest, more distribution may produce diminishing returns. The next growth lever is probably somewhere else. Perhaps the brand needs stronger communication, a better price-pack structure, improved visibility or a product proposition consumers find more compelling. This is where distribution metrics stop being reporting numbers and start becoming diagnostic tools.
The Practical Reality: Productive Distribution vs Empty Door Listings
There is another layer that makes the whole subject more practical: productive distribution.
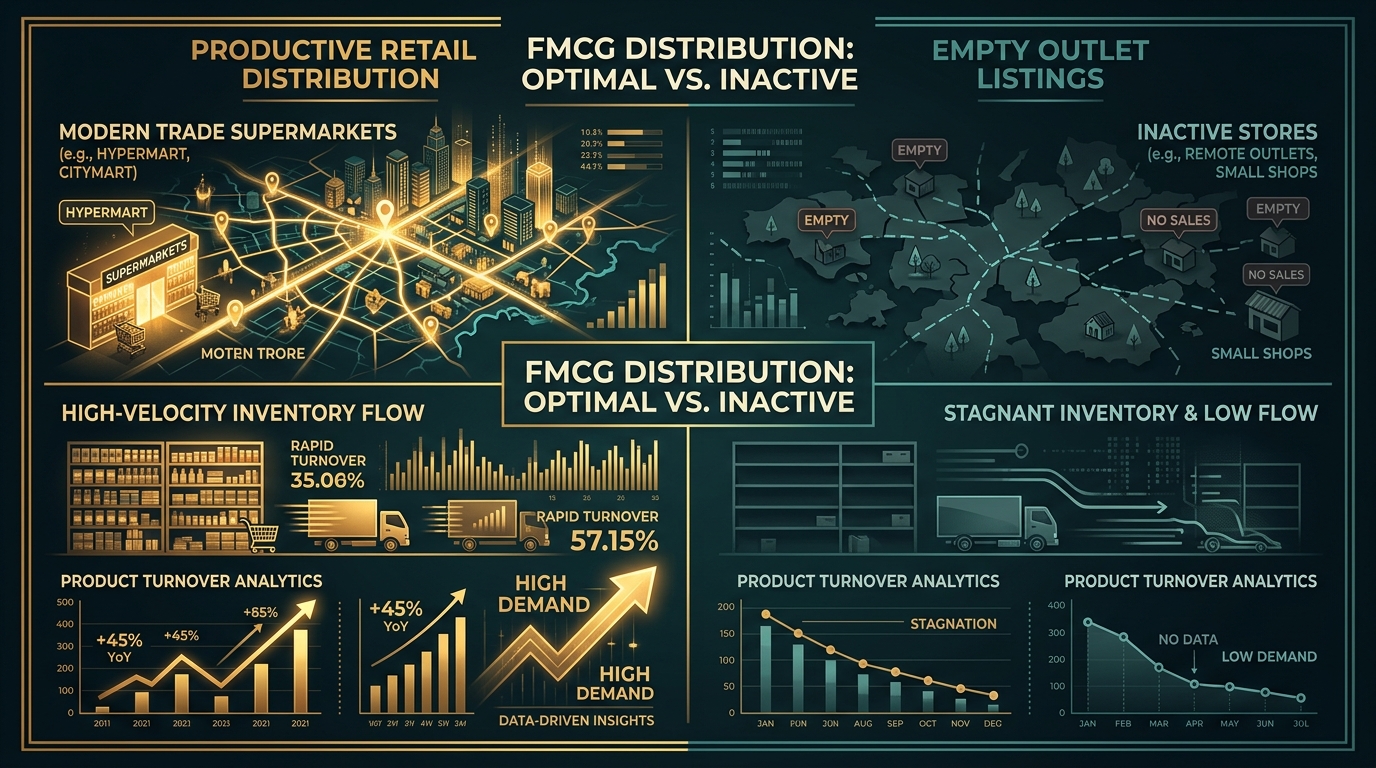
A product can be technically listed in an outlet without being commercially alive there. Anyone who has worked with large distributor databases knows this. The system says the SKU is present, the representative says the account is active, the distributor reports the shipment, yet the stock does not move. In extreme cases, everyone upstream has recorded a sale except the one person the business ultimately depends on: the consumer.
Suppose your product is present in 15,000 outlets, but only 8,000 sell at least one case a month. The gap between theoretical distribution and productive distribution should make management curious. Some outlets may simply be low-frequency stores, but others may have execution problems. Perhaps the stock is sitting in the back room, perhaps the price is wrong, perhaps the product is frequently out of stock despite nominal listing, or perhaps the store simply has little demand for the category. Whatever the explanation, saying the brand has 15,000 outlets does not capture the real commercial position if almost half of them are barely moving product.
This is particularly relevant in Indonesia because stock can travel through several layers before reaching the consumer. Product moves from manufacturer to distributor, from distributor to wholesaler, from wholesaler to retailer, and each transfer can create the appearance of commercial progress. Yet if the retailer does not reorder, all that has really happened is that inventory has migrated closer to the consumer without becoming consumption. A warehouse full of stock is not a particularly attractive end user, despite its impressive storage capacity.
This is why the best distribution conversations eventually become about repeat rather than listing. Are outlets reordering? Is the rate of sale healthy? Does the product remain in the assortment once the initial push ends? Is the distribution sustainable without constant discounting or distributor incentives? Those questions are less glamorous than launch coverage, but they tell you whether the market has actually accepted the product.
Strategic Resource Allocation: Where Not to Go
The difference between numerical and weighted distribution becomes even more important when management starts allocating limited resources. Large multinationals can eventually pursue very broad physical coverage, but smaller brands usually cannot. A young coffee, chocolate, beverage or snack company in Indonesia has limited salespeople, limited working capital and limited trade-spend money. It needs to decide where not to go as much as where to go. In that situation, distribution quality is not a theoretical KPI; it is a survival issue.
The smartest smaller brands often build a productive core first. They identify outlets where the category already moves, secure good placement, prove rate of sale and use those accounts to generate repeat and credibility before expanding more widely. This approach may produce a less dramatic numerical-distribution figure in the early months, but it often creates much healthier economics. The alternative is to chase every available door, spread inventory thinly and then discover six months later that the map looks wonderful while the P&L does not.
The same principle applies regionally. A national numerical-distribution number can hide very different realities. A brand may show 60% numerical distribution across Indonesia while being weak in Jakarta, Surabaya and Bandung and heavily overrepresented in lower-value regions. Another brand may have only 30% national numerical distribution but dominate the largest urban category pools. Neither position is inherently good or bad; the point is that the national headline alone does not tell you enough. Weighted distribution adds the commercial context, and regional weighting makes the picture more useful still.
This is also where distributor management becomes important. Manufacturers and distributors do not always optimise for exactly the same thing. The manufacturer may want aggressive outlet expansion because it is building a brand. The distributor may prefer faster-moving SKUs, productive routes and accounts that justify the cost of servicing them. Both are rational. Problems arise when the manufacturer sets a simple outlet-count target that encourages the distributor to open low-quality doors simply to hit the number. The field salesperson then becomes the person trying to reconcile a KPI designed at head office with the economics of actual selling.
Good route-to-market management therefore requires a little more sophistication than “open more outlets.” It does not mean creating a dashboard so complicated that the field force needs a statistician in the passenger seat. It simply means recognising that a new outlet and a valuable new outlet are not the same achievement.
The same logic applies when companies review market share. If a brand has high weighted distribution but low share, adding distribution is unlikely to fix the underlying issue. If it has strong share despite modest weighted distribution, expansion may be the obvious growth opportunity. If distribution is high but productive distribution is weak, execution may be the problem. If productive distribution is strong but velocity is falling, something is happening with demand. The measures work best when they tell a story together rather than when each one appears on a different slide in a different section of the monthly deck.
That is perhaps the broader lesson. FMCG has become increasingly fascinated by sophisticated tools, AI, retail media, predictive analytics and digital transformation, and all of these things matter. Yet a surprising amount of commercial performance still comes back to very basic questions. Is the product available? Is it available where the category sells? Is it moving? Are outlets reordering? Are consumers choosing it?
These questions are old because they are important.
Numerical distribution remains valuable because reach matters. Weighted distribution matters because not all reach is equal. Productive distribution matters because a listing that does not sell is not much of a commercial achievement. Velocity matters because eventually somebody has to actually buy the thing.
Taken together, they provide a far more useful picture than a proud announcement that the brand is now in 10,000 stores.
So when the sales team walks into the next monthly meeting with another 2,000 outlets added, they should absolutely be congratulated. Then the next question should be which 2,000, how much category value those stores represent, whether they are productive and whether they are reordering. Not because outlet expansion is unimportant, but because distribution is too expensive and too strategically important to measure by counting doors alone.
Ten thousand outlets can make a magnificent slide.
But if the category is being bought somewhere else, you have not built distribution.
You have built a very large address book.
Tools for this topic
View shopFMCG Growth Systems (Hardcover)
A tactical leadership guide for building scalable FMCG growth engines.
Related content
Stop Riding Around With Your Salesman: How an Area Sales Supervisor Should Actually Spend a Day in the Field
A field visit only becomes valuable when something in the territory is actually better because the supervisor was there. Here is how FMCG area sales supervisors move from ceremonial ride-alongs to route quality, real coaching, and disciplined field execution.
The Product Is Everywhere. So Why Is It Always Out of Stock?
Why distribution, availability, and being able to actually buy the product are not the same thing. How out-of-stocks silently destroy FMCG sales while internal dashboards stay green.
How to Know Whether a Sales Visit Actually Makes Money Without Sacrificing Your Brand
Improving sales route profitability sounds like an obvious objective for any FMCG company. But aggressive cost-to-serve cuts and minimum order sizes can kill a growing brand. Here is how to evaluate true visit economics, protect developing outlets, and balance route efficiency with long-term brand building in Southeast Asia.
How to Build a Better FMCG Route-to-Market
Designing channel roles, distributor economics, and service levels in one RTM framework.