El Niño Is Coming for Your Gross Margin: What Indonesia’s Staple Prices Mean for Pack-Price Architecture
Indonesia's rising staple prices matter less as an inflation headline than as a warning for FMCG gross margins. The practical response is to map ingredient exposure, understand cost lags and redesign pack-price architecture before cost increases reach the P&L.
El Niño Is Coming for Your Gross Margin: What Indonesia’s Staple Prices Mean for Pack-Price Architecture
Indonesia does not need another article explaining that food prices go up when the weather misbehaves. FMCG companies need to know which SKU gets hurt, by how much, how quickly, and whether the answer is a higher price, a smaller pack, a different pack, or simply holding your nerve.
A chilli price of Rp114,000 per kilogram makes a good headline. A 180-basis-point deterioration in gross margin does not, which is unfortunate because the second one is normally the problem that eventually lands on somebody’s desk with several people asking why nobody saw it coming.
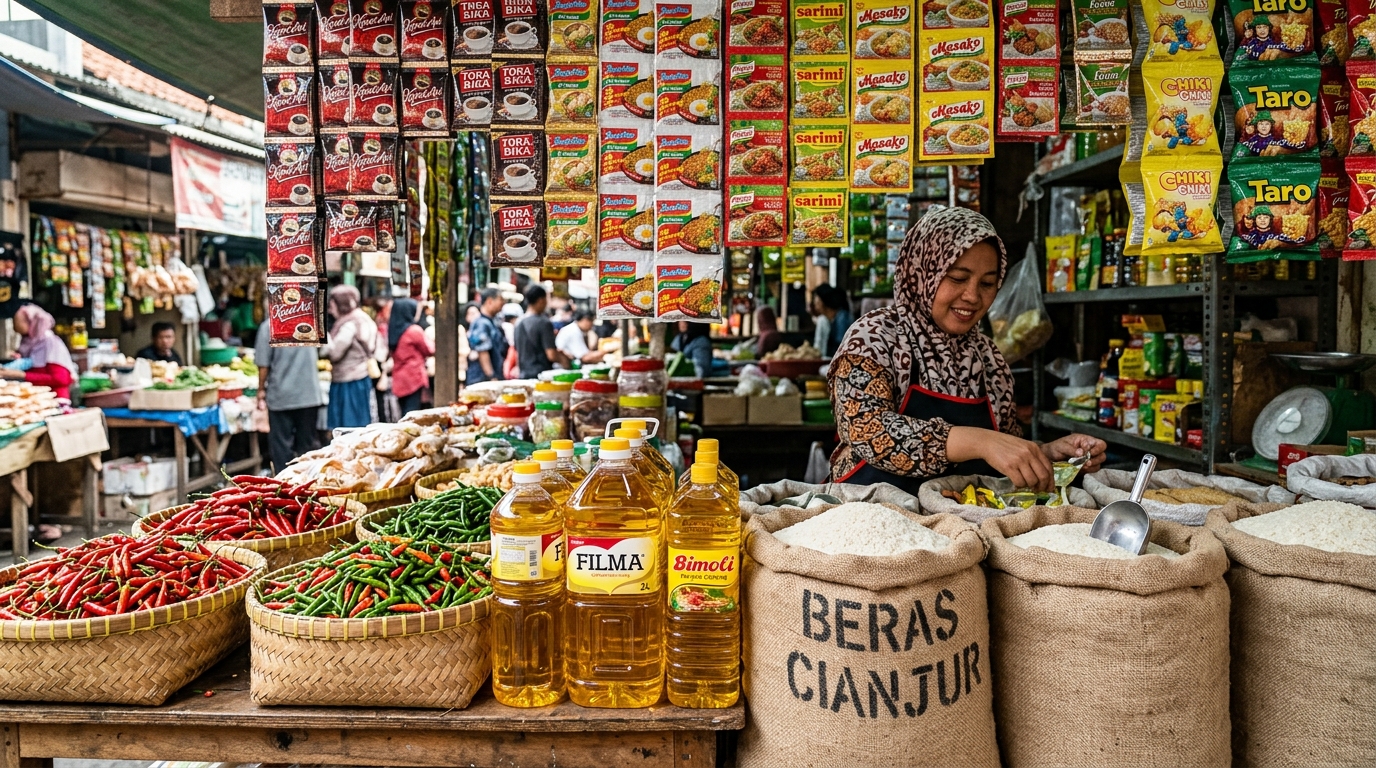
As of the morning of 6 October, Bank Indonesia's PIHPS data put red bird's-eye chilli at Rp114,000/kg nationally, lower-quality rice at around Rp15,850–15,900/kg, medium rice at Rp16,550–17,000/kg, premium sugar at Rp20,650/kg and bulk cooking oil at Rp20,850/litre. These are retail indicators rather than the prices an FMCG manufacturer will necessarily pay its suppliers, but the direction and velocity are useful.
Five days earlier, on 1 October, the comparable readings included Rp101,550/kg for red bird's-eye chilli, Rp15,450/kg for lower-quality rice I, Rp16,550/kg for medium rice I and Rp20,400/litre for bulk cooking oil. In other words, some of the more relevant food-price indicators are not politely waiting for the quarterly pricing meeting before moving.
And this is not simply one excitable week at the pasar. BPS reported that average September rice prices at the huller level had risen 0.81% month-on-month for premium rice and 0.87% for medium rice. By the first week of October, BPS was still recording increases in rice prices across all quality grades in 116 regencies and cities. Bank Indonesia, meanwhile, reported September volatile-food inflation at 5.03% year-on-year, up from 4.06% a month earlier.
The weather signal gives the numbers rather more importance. BMKG's 5 October assessment put the three-month ENSO index for July–September at +2.70, classifying the current El Niño as very strong. Its 2026/27 rainy-season outlook expects El Niño conditions to persist into early 2027, with the rainy season starting later than normal across a large part of Indonesia and being shorter than normal across many areas. That does not guarantee every agricultural commodity will rise every week. It does mean an FMCG company should probably stop treating agricultural cost pressure as an interesting article in the newspaper and start putting it into the SKU margin model.
Forget “inflation”. Build an ingredient exposure map.
The first mistake is looking at the Consumer Price Index and applying 5% inflation to next year's budget. That may produce a respectable PowerPoint slide, but it tells you almost nothing about your actual business.
Start with every meaningful SKU and break its variable cost into what can actually move. For a snack manufacturer that might be cooking oil, flour or starch, seasoning, sugar, agricultural inputs, film, carton, freight and manufacturing conversion cost. For a sauce producer it may be chilli, onion, garlic, sugar, oil, bottles or sachet film. For beverages it can be sugar or sweetener, dairy inputs, PET, cans, cartons, energy and transport. Instant noodles have their own lovely cocktail of flour, oil, seasoning and packaging exposure.
Now multiply the exposure by the plausible input movement rather than multiplying the entire COGS by some convenient inflation percentage.
Imagine a Rp2,000 snack pack with Rp1,200 of variable COGS. Assume cooking oil represents Rp220 of that cost. If the manufacturer's effective oil cost eventually increases by 10%, the direct oil impact is Rp22 per pack. That sounds trivial until you remember that gross contribution before fixed costs might only be Rp800. One ingredient has just eaten almost 3% of that contribution. If flour, seasoning, transport and packaging decide to join the party, the commercial director suddenly discovers why the finance director has stopped smiling.
This is also why commodity volatility and consumer inflation are not the same thing. A chilli-heavy sambal SKU can be damaged enormously by a movement that barely registers in national CPI. A biscuit with little exposure to fresh agricultural commodities may be comparatively comfortable. Category averages are therefore interesting for economists and occasionally useless for SKU management.
The important number is not today's commodity price. It is your cost lag.
A procurement manager buying under a three-month contract has a different problem from a business purchasing fresh ingredients weekly. The question is not merely “has rice gone up?” It is “when does the increase enter our P&L?”
Every important raw material should have a cost-lag assumption. Perhaps an oil contract resets monthly. Sugar might reprice after six weeks. Chilli paste supplied by a processor may lag fresh chilli prices but then move sharply when the processor renews its contracts. Packaging may appear unrelated to El Niño until energy, freight or resin costs change. Agricultural pressure can therefore arrive in waves rather than as one neat inflation event.
That matters enormously for pricing because Indonesian FMCG price changes also have a lag. Sales needs distributor discussions, modern trade requires communication or approval, packaging may need to change, the ERP needs updating, price lists have to move and somebody eventually has to explain the entire adventure to the consumer.
If your raw-material increase hits in November and your new selling price cannot realistically reach stores until February, you do not have a pricing problem. You have a three-month margin hole.
Indonesia is a pack-price market, so manage the price point first.
This is where the discussion gets much more practical.
A multinational spreadsheet may tell you that a SKU needs a 6.4% price increase. Unfortunately, the warung does not have a button marked “increase recommended retail price by 6.4%.”
Consumers shop around recognisable price points: Rp1,000, Rp2,000, Rp5,000, Rp10,000 and whatever price architecture is established in the particular category and channel. That makes Indonesia especially suited to pack-price management rather than simple percentage pricing.
Suppose the economics say your Rp2,000 sachet should become Rp2,120. That may be mathematically beautiful and commercially ridiculous. The real options are to protect the Rp2,000 entry pack with a modest grammage adjustment, move the existing pack to the next viable price point, introduce an intermediate pack, create better value in a multipack or larger format, or accept some temporary margin compression while procurement volatility settles.
The right answer will differ by channel. A neighbourhood warung shopper buying for immediate consumption behaves differently from someone buying a larger pouch on Shopee, in Alfamart or during a supermarket promotion. This is precisely why one national price increase applied equally across every pack and channel is usually the laziest possible response.
And yes, reducing grammage is an option. It is not a magical one. Packaging costs do not fall proportionally when you remove 8% of the product, factory conversion costs may barely change, the consumer may notice, competitors may attack you and Indonesia has labelling requirements for declared net contents. Shrinkflation only works commercially when the saving is meaningful and the resulting proposition still makes sense. Taking three grams out of a pack merely because Excel suggested it is not strategy. It is Excel with scissors.
Run the margin waterfall before touching the pack.
For every vulnerable SKU, the commercial and finance teams should model the actual waterfall from shelf price back to manufacturer contribution.
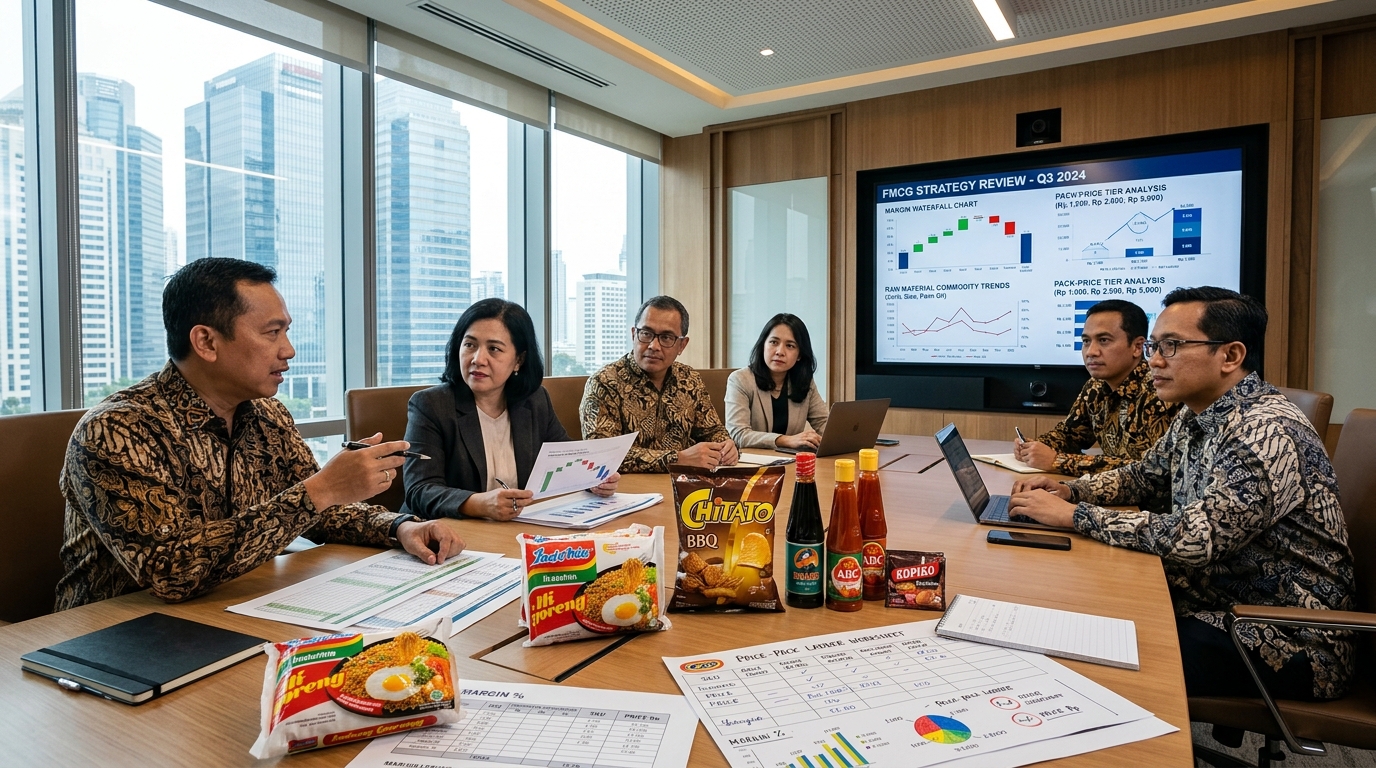
Take a hypothetical sauce sachet selling to the consumer at Rp2,000. Assume the manufacturer receives Rp1,450 after the channel structure, and variable COGS is Rp1,000, leaving Rp450 of contribution. If chilli, onion and related agricultural ingredients account for Rp180 of that COGS and their weighted cost increases 25%, the direct impact is Rp45.
Your contribution has just dropped from Rp450 to Rp405, a 10% reduction in contribution, even though total COGS increased by only 4.5%.
That distinction matters. Senior management will often hear that “cost increased four or five percent” and conclude that the situation is manageable. The brand manager responsible for a 10% hit to contribution may have a slightly different interpretation.
From there you can model the choices properly. What happens if the RRP moves to Rp2,500? Can the channel support that jump? What if Rp2,000 remains the entry price but the pack becomes smaller? Could a Rp5,000 pack deliver a visibly better value-per-gram proposition and migrate some users upward? Can promotional intensity be reduced instead of changing headline price? Is the category sufficiently differentiated to absorb a price increase without destroying volume?
These are commercial questions, not meteorological ones.
Do not change prices because chilli had a bad Tuesday.
Daily commodity numbers can be spectacularly noisy. On 5 October, PIHPS showed medium rice I at Rp17,800/kg; the following morning the quoted figure was Rp17,000. Premium sugar moved from Rp23,300 to Rp20,650 over the same two snapshots. Fresh commodities in particular can jump around enough to give a pricing committee motion sickness.
So the trigger should not be “ingredient price increased today.” A more sensible internal trigger combines magnitude, persistence and margin exposure. If a commodity moves sharply but represents 2% of your SKU cost, observe it. If an input basket representing 30% of COGS has moved for six consecutive weeks and your forward purchasing indicates the increase will enter your factory cost next month, do something.
I would therefore run three scenarios for every exposed hero SKU: normalisation, sustained pressure and further deterioration. Not because anyone can forecast the exact price of rice in January, but because management needs to know at which point each SKU stops making economic sense.
The output should be brutally simple: projected COGS, projected gross margin, weeks until impact, weeks required to execute a pricing or pack change, and the recommended commercial action.
If that dashboard needs twelve tabs and a data scientist to explain it, start again.
Watch the second-order effects as well.
El Niño does not need to hit your ingredient directly to hurt the P&L. Drier conditions can affect agricultural yields, processing availability, water usage and regional supply flows. Logistics become important when shortages are geographically uneven. BPS's finding that rice was still increasing in 116 regencies and cities illustrates precisely why a national average can hide substantial regional differences.
That can create a peculiar situation in which your nationally averaged procurement model looks manageable while a distributor in eastern Indonesia is dealing with a completely different cost environment. It is therefore worth combining procurement data with regional sell-out, distributor inventory and local competitive pricing rather than assuming Java represents the whole country. Indonesia has never been especially cooperative with simple national averages.
Government intervention also matters. Bapanas has increased Bulog's SPHP rice allocation by another 74,180 tonnes after an earlier 828,000-tonne assignment was completed in September. That can moderate consumer-price pressure, but it is another reason not to build an FMCG pricing decision around a straight-line extrapolation of today's spot price. Policy can alter availability and market behaviour quickly.
The best time to redesign your pack ladder is before you need it.
This is perhaps the most important point.
If El Niño disappears tomorrow and agricultural prices calm down, a good pack-price architecture exercise will not have been wasted. You will still understand which SKUs create contribution, which exist merely to create volume, where consumers enter the franchise, where they trade up, which packs cannibalise each other and where the business has room to move.
But if BMKG is right and the strong El Niño continues into early 2027, waiting until your supplier sends the new price list is rather late to discover that your bestselling Rp2,000 pack has nowhere commercially sensible to go.
So do the work now. Map ingredient exposure SKU by SKU. Calculate the cost lag. Build a margin waterfall. Model the next viable price points. Decide which packs you would resize, which you would reprice, which you would defend and which you would happily allow to disappear. Then establish trigger levels so the decision is made from economics rather than panic.
Indonesia's current staple-price movement is not primarily an inflation story for an FMCG operator.
It is a warning that pack-price architecture is about to earn its salary.
Tools for this topic
View shopFMCG Revenue Growth Sprint
A practical RGM sprint program for commercial teams.
The FMCG Pricing Handbook (eBook)
A practical handbook to design profitable price-pack architecture.
Related content
Your Sales Are Up 30%. Congratulations. Now Tell Me How Many More Units You Actually Sold.
Why FMCG commercial teams must separate top-line revenue growth from physical volume, penetration, pack-price architecture, and net contribution—especially in Indonesia.
The 30-Store Trap: Why FMCG Growth Comes From Developing Existing Outlets, Not Just Visiting More of Them
Visiting 30 outlets a day is easy to measure, but real FMCG growth happens inside the store. Here is how field salespeople move beyond basic replenishment, overcome 'Masih ada stok, Mas,' and expand from one SKU to eight in Indonesian general trade.
Stop Riding Around With Your Salesman: How an Area Sales Supervisor Should Actually Spend a Day in the Field
A field visit only becomes valuable when something in the territory is actually better because the supervisor was there. Here is how FMCG area sales supervisors move from ceremonial ride-alongs to route quality, real coaching, and disciplined field execution.